plot_gene_peakedness
plot_gene_peakedness.Rdplot_gene_peakedness
Arguments
- sce
SingleCellExperiment::SingleCellExperiment to plot gene from. Must contain pseudotime, and normcounts
- gene_peakedness_df
The DataFrame Result of
calculate_gene_peakedness- gene
String. The name of the gene to plot. Must be present in the SCE and gene_peakedness_df
- pseudotime_slot
String. The pseudotime column in the SingleCellExperiment::SingleCellExperiment object metadata.
Value
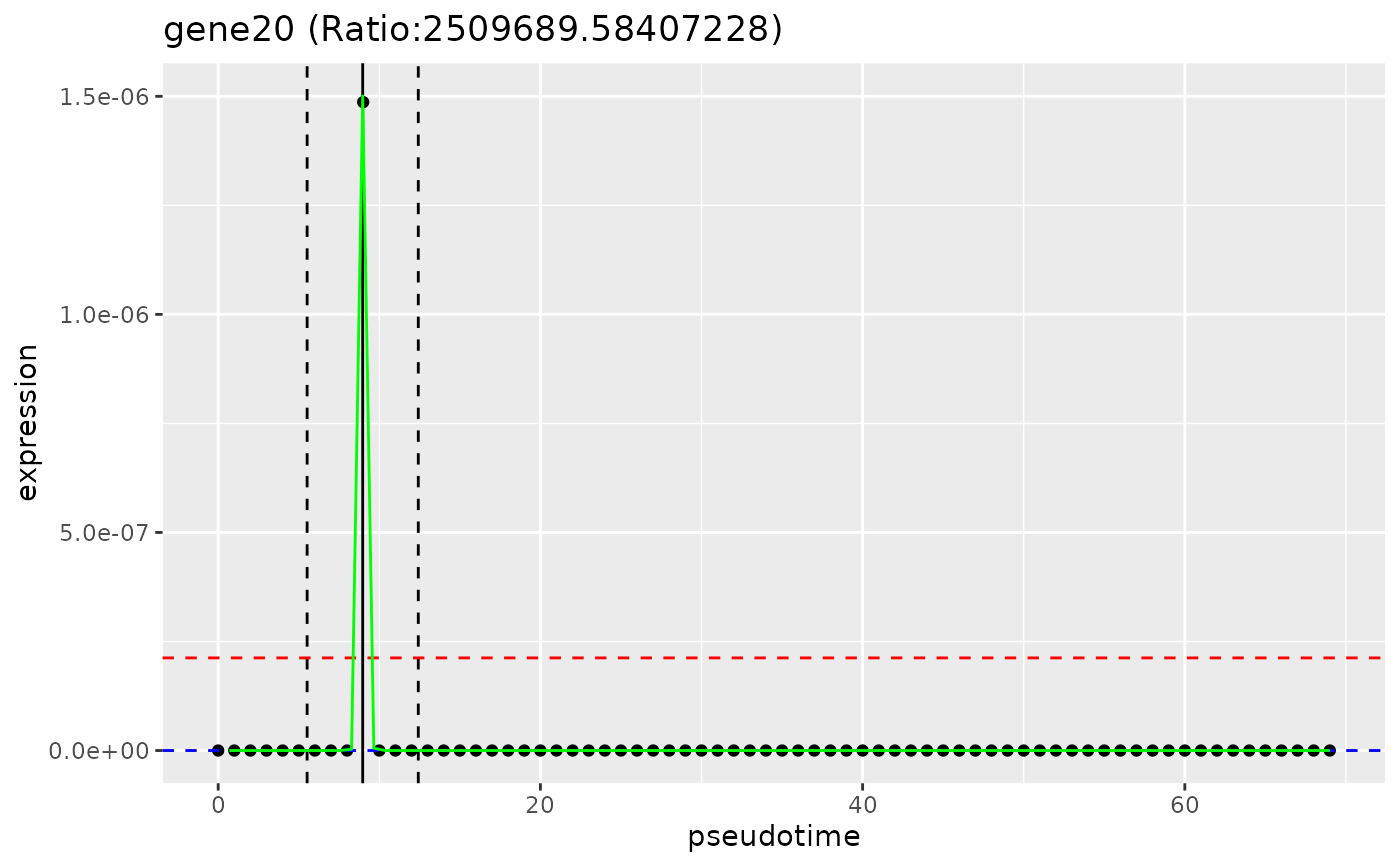
A ggplot2::ggplot2 plot showing: in black points, expression of the gene over pseudotime, in a green line, the fitted expression of the gene over pseudotime, the inside and outside of window means of smoothed expression (red and blue dotted horizotal lines respectively), and the bounds of the window (in black dotted vertical lines).
Examples
ncells <- 70
ngenes <- 100
# Each gene should have mean around its gene number
counts <- c()
for (i in seq_len(ngenes)) {
counts <- c(counts, dnorm(seq_len(ncells), mean = (ncells / i), sd = 1))
}
counts_matrix <- matrix(
counts,
ncol = ncells,
nrow = ngenes
)
sce <- SingleCellExperiment::SingleCellExperiment(assays = list(
counts = counts_matrix * 3,
normcounts = counts_matrix,
logcounts = log(counts_matrix)
))
colnames(sce) <- paste0("cell", seq_len(ncells))
rownames(sce) <- paste0("gene", seq_len(ngenes))
sce$cell_type <- c(
rep("celltype_1", ncells / 2),
rep("celltype_2", ncells / 2)
)
sce$pseudotime <- seq_len(ncells) - 1
genelist <- rownames(sce)
# calculate_gene_peakedness
gene_peakedness <- calculate_gene_peakedness(
sce,
pseudotime_slot = "pseudotime"
)
#> Warning: Iteration limit reached without full convergence - check carefully
#> Warning: Iteration limit reached without full convergence - check carefully
#> Warning: Fitting terminated with step failure - check results carefully
#> Warning: Fitting terminated with step failure - check results carefully
#> Warning: Iteration limit reached without full convergence - check carefully
#> Warning: Iteration limit reached without full convergence - check carefully
#> Warning: Iteration limit reached without full convergence - check carefully
#> Warning: Iteration limit reached without full convergence - check carefully
#> Warning: Fitting terminated with step failure - check results carefully
#> Warning: Fitting terminated with step failure - check results carefully
#> Warning: Iteration limit reached without full convergence - check carefully
#> Warning: Iteration limit reached without full convergence - check carefully
#> Warning: Iteration limit reached without full convergence - check carefully
head(gene_peakedness)
#> gene peak_pseudotime mean_in_window mean_out_window ratio
#> 100 gene1 69.00 1.060616e-24 0.037863935 2.801125e-23
#> 51 gene2 35.19 4.680824e-02 0.029379725 1.593216e+00
#> 27 gene3 18.63 4.327921e-02 0.014445463 2.996042e+00
#> 20 gene4 13.80 4.563543e-02 0.006531685 6.986777e+00
#> 1 gene5 0.69 7.978846e-02 0.004138929 1.927756e+01
#> 5 gene6 3.45 3.456725e-02 0.006114805 5.653041e+00
#> window_start window_end deviance_explained
#> 100 65.55 72.45 0.02680534
#> 51 31.74 38.64 0.01912609
#> 27 15.18 22.08 0.04505152
#> 20 10.35 17.25 0.58156238
#> 1 -2.76 4.14 0.21032129
#> 5 0.00 6.90 0.14902599
# plot_gene_peakedness
plot_gene_peakedness(sce, gene_peakedness, "gene20",
pseudotime_slot = "pseudotime"
)
#> Warning: Iteration limit reached without full convergence - check carefully
 # smooth_gene
smoothed_gene20 <- smooth_gene(
sce, "gene20",
pseudotime_slot = "pseudotime"
)
#> Warning: Iteration limit reached without full convergence - check carefully
head(smoothed_gene20)
#> 1 2 3 4 5 6
#> 2.220446e-16 2.220446e-16 2.220446e-16 2.220446e-16 2.220446e-16 2.220446e-16
# Select best spread of genes
genes_to_use <- gene_peakedness_spread_selection(sce, gene_peakedness,
genes_per_bin = 2, n_gene_bins = 1, pseudotime_slot = "pseudotime"
)
print(genes_to_use)
#> [1] "gene30" "gene40"
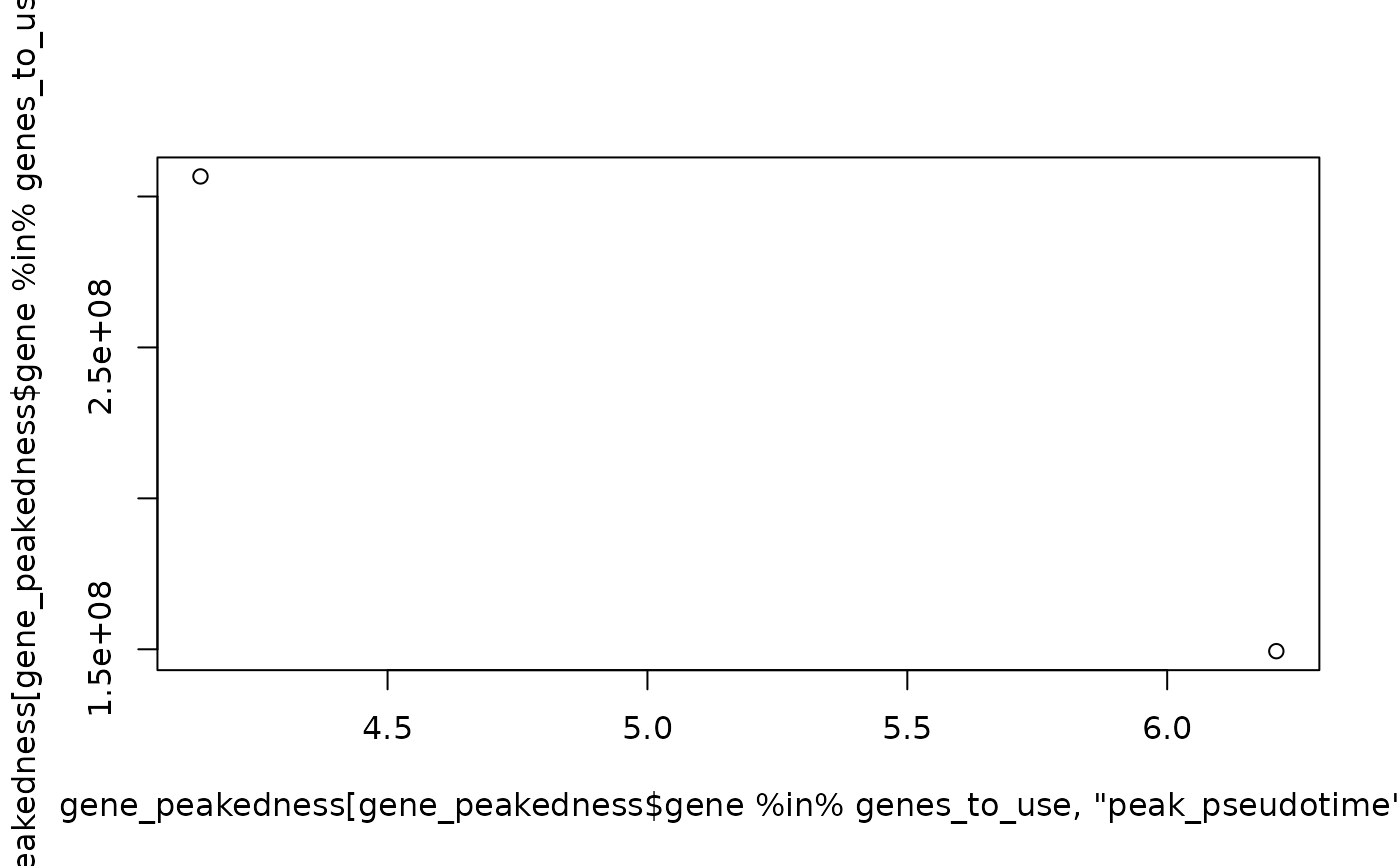
plot(
x = gene_peakedness[
gene_peakedness$gene %in% genes_to_use, "peak_pseudotime"
],
y = gene_peakedness[gene_peakedness$gene %in% genes_to_use, "ratio"]
)
# smooth_gene
smoothed_gene20 <- smooth_gene(
sce, "gene20",
pseudotime_slot = "pseudotime"
)
#> Warning: Iteration limit reached without full convergence - check carefully
head(smoothed_gene20)
#> 1 2 3 4 5 6
#> 2.220446e-16 2.220446e-16 2.220446e-16 2.220446e-16 2.220446e-16 2.220446e-16
# Select best spread of genes
genes_to_use <- gene_peakedness_spread_selection(sce, gene_peakedness,
genes_per_bin = 2, n_gene_bins = 1, pseudotime_slot = "pseudotime"
)
print(genes_to_use)
#> [1] "gene30" "gene40"
plot(
x = gene_peakedness[
gene_peakedness$gene %in% genes_to_use, "peak_pseudotime"
],
y = gene_peakedness[gene_peakedness$gene %in% genes_to_use, "ratio"]
)