calculate_gene_peakedness
calculate_gene_peakedness.RdCalculate the peakedness of a gene. The power is the ratio of the mean of reads 5% either side of the smoothed peak of the gene's expression over pseudotime against the mean of the reads outside of this.
This function can take some time to complete, please be patient.
Usage
calculate_gene_peakedness(
  sce,
  window_pct = 10,
  pseudotime_slot = "slingPseudotime_1",
  knots = 10,
  BPPARAM = BiocParallel::SerialParam()
)
Arguments
- sce
SingleCellExperiment::SingleCellExperiment to do the calculations on.
- window_pct
Decimal between 0-100. The size of the window to consider, as a percentage of the maximum pseudotime value.
- pseudotime_slot
String. The name of the metadata column in the SCE object containing pseudotime
- knots
Integer. The number of knots to use when fitting the GAM
- BPPARAM
The BiocParallel::BiocParallelParam for parallelisation. Defaults to BiocParallel::SerialParam.
Value
Dataframe, where each row is a gene, and the following columns: mean_expression_in_window (decimal), mean_expression_out_window (decimal), ratio (decimal)
Examples
ncells <- 70
ngenes <- 100
# Each gene should have mean around its gene number
counts <- c()
for (i in seq_len(ngenes)) {
counts <- c(counts, dnorm(seq_len(ncells), mean = (ncells / i), sd = 1))
}
counts_matrix <- matrix(
counts,
ncol = ncells,
nrow = ngenes
)
sce <- SingleCellExperiment::SingleCellExperiment(assays = list(
counts = counts_matrix * 3,
normcounts = counts_matrix,
logcounts = log(counts_matrix)
))
colnames(sce) <- paste0("cell", seq_len(ncells))
rownames(sce) <- paste0("gene", seq_len(ngenes))
sce$cell_type <- c(
rep("celltype_1", ncells / 2),
rep("celltype_2", ncells / 2)
)
sce$pseudotime <- seq_len(ncells) - 1
genelist <- rownames(sce)
# calculate_gene_peakedness
gene_peakedness <- calculate_gene_peakedness(
sce,
pseudotime_slot = "pseudotime"
)
#> Warning: Iteration limit reached without full convergence - check carefully
#> Warning: Iteration limit reached without full convergence - check carefully
#> Warning: Fitting terminated with step failure - check results carefully
#> Warning: Fitting terminated with step failure - check results carefully
#> Warning: Iteration limit reached without full convergence - check carefully
#> Warning: Iteration limit reached without full convergence - check carefully
#> Warning: Iteration limit reached without full convergence - check carefully
#> Warning: Iteration limit reached without full convergence - check carefully
#> Warning: Fitting terminated with step failure - check results carefully
#> Warning: Fitting terminated with step failure - check results carefully
#> Warning: Iteration limit reached without full convergence - check carefully
#> Warning: Iteration limit reached without full convergence - check carefully
#> Warning: Iteration limit reached without full convergence - check carefully
head(gene_peakedness)
#> gene peak_pseudotime mean_in_window mean_out_window ratio
#> 100 gene1 69.00 1.060616e-24 0.037863935 2.801125e-23
#> 51 gene2 35.19 4.680824e-02 0.029379725 1.593216e+00
#> 27 gene3 18.63 4.327921e-02 0.014445463 2.996042e+00
#> 20 gene4 13.80 4.563543e-02 0.006531685 6.986777e+00
#> 1 gene5 0.69 7.978846e-02 0.004138929 1.927756e+01
#> 5 gene6 3.45 3.456725e-02 0.006114805 5.653041e+00
#> window_start window_end deviance_explained
#> 100 65.55 72.45 0.02680534
#> 51 31.74 38.64 0.01912609
#> 27 15.18 22.08 0.04505152
#> 20 10.35 17.25 0.58156238
#> 1 -2.76 4.14 0.21032129
#> 5 0.00 6.90 0.14902599
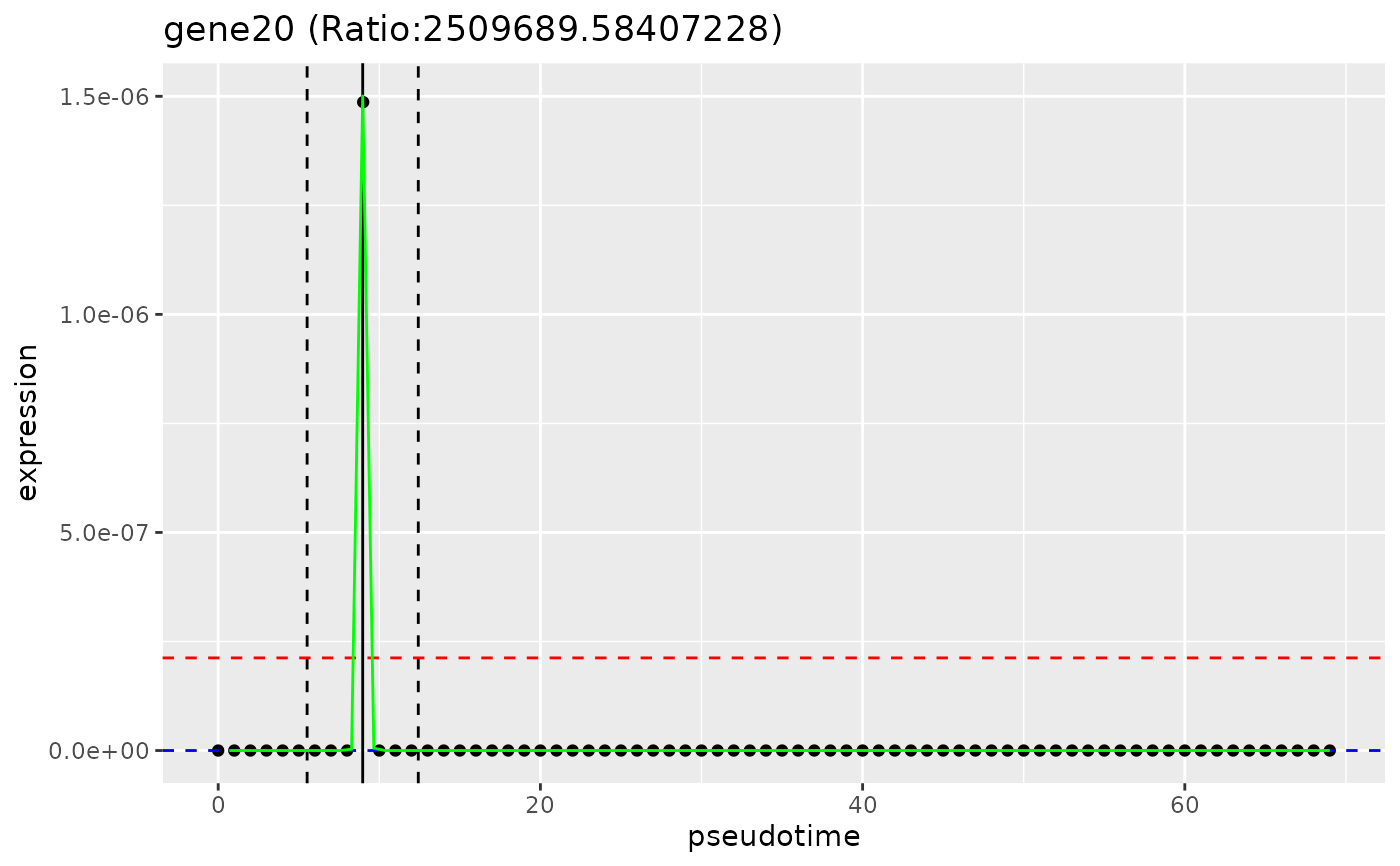
# plot_gene_peakedness
plot_gene_peakedness(sce, gene_peakedness, "gene20",
pseudotime_slot = "pseudotime"
)
#> Warning: Iteration limit reached without full convergence - check carefully
 # smooth_gene
smoothed_gene20 <- smooth_gene(
sce, "gene20",
pseudotime_slot = "pseudotime"
)
#> Warning: Iteration limit reached without full convergence - check carefully
head(smoothed_gene20)
#> 1 2 3 4 5 6
#> 2.220446e-16 2.220446e-16 2.220446e-16 2.220446e-16 2.220446e-16 2.220446e-16
# Select best spread of genes
genes_to_use <- gene_peakedness_spread_selection(sce, gene_peakedness,
genes_per_bin = 2, n_gene_bins = 1, pseudotime_slot = "pseudotime"
)
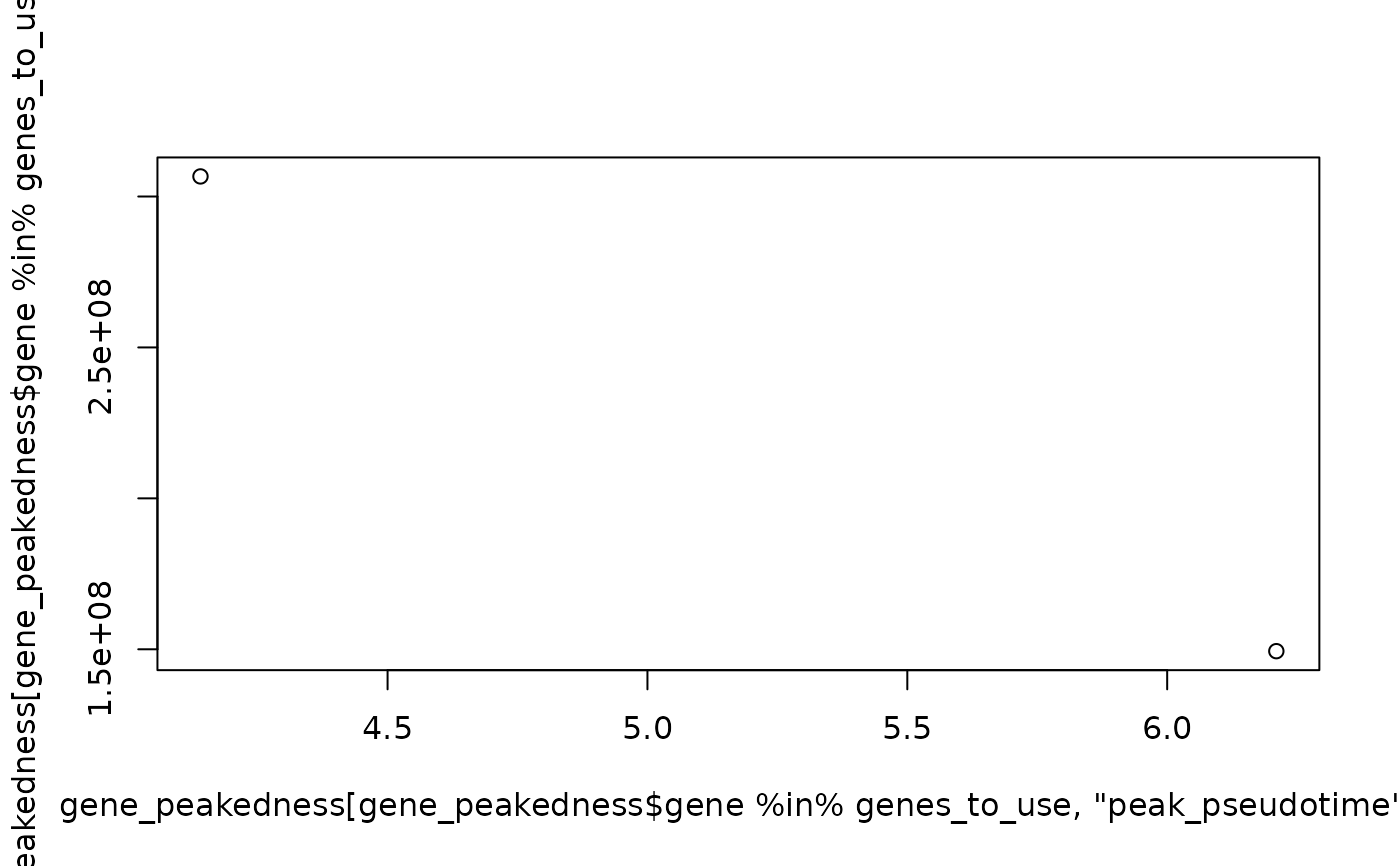
print(genes_to_use)
#> [1] "gene30" "gene40"
plot(
x = gene_peakedness[
gene_peakedness$gene %in% genes_to_use, "peak_pseudotime"
],
y = gene_peakedness[gene_peakedness$gene %in% genes_to_use, "ratio"]
)
# smooth_gene
smoothed_gene20 <- smooth_gene(
sce, "gene20",
pseudotime_slot = "pseudotime"
)
#> Warning: Iteration limit reached without full convergence - check carefully
head(smoothed_gene20)
#> 1 2 3 4 5 6
#> 2.220446e-16 2.220446e-16 2.220446e-16 2.220446e-16 2.220446e-16 2.220446e-16
# Select best spread of genes
genes_to_use <- gene_peakedness_spread_selection(sce, gene_peakedness,
genes_per_bin = 2, n_gene_bins = 1, pseudotime_slot = "pseudotime"
)
print(genes_to_use)
#> [1] "gene30" "gene40"
plot(
x = gene_peakedness[
gene_peakedness$gene %in% genes_to_use, "peak_pseudotime"
],
y = gene_peakedness[gene_peakedness$gene %in% genes_to_use, "ratio"]
)