Plot the results of the search for good parameters
plot_find_best_params_results.RdPlot the results of the search for good parameters
Usage
plot_find_best_params_results(
  find_best_params_results,
  bin_count_colors = viridis::scale_color_viridis(option = "viridis"),
  gene_count_colors = viridis::scale_color_viridis(option = "magma")
)
Arguments
- find_best_params_results
Dataframe. Results dataframe from
find_best_params()- bin_count_colors
Optional, custom bin count scale color scheme.
- gene_count_colors
Optional, custom gene count scale color scheme.
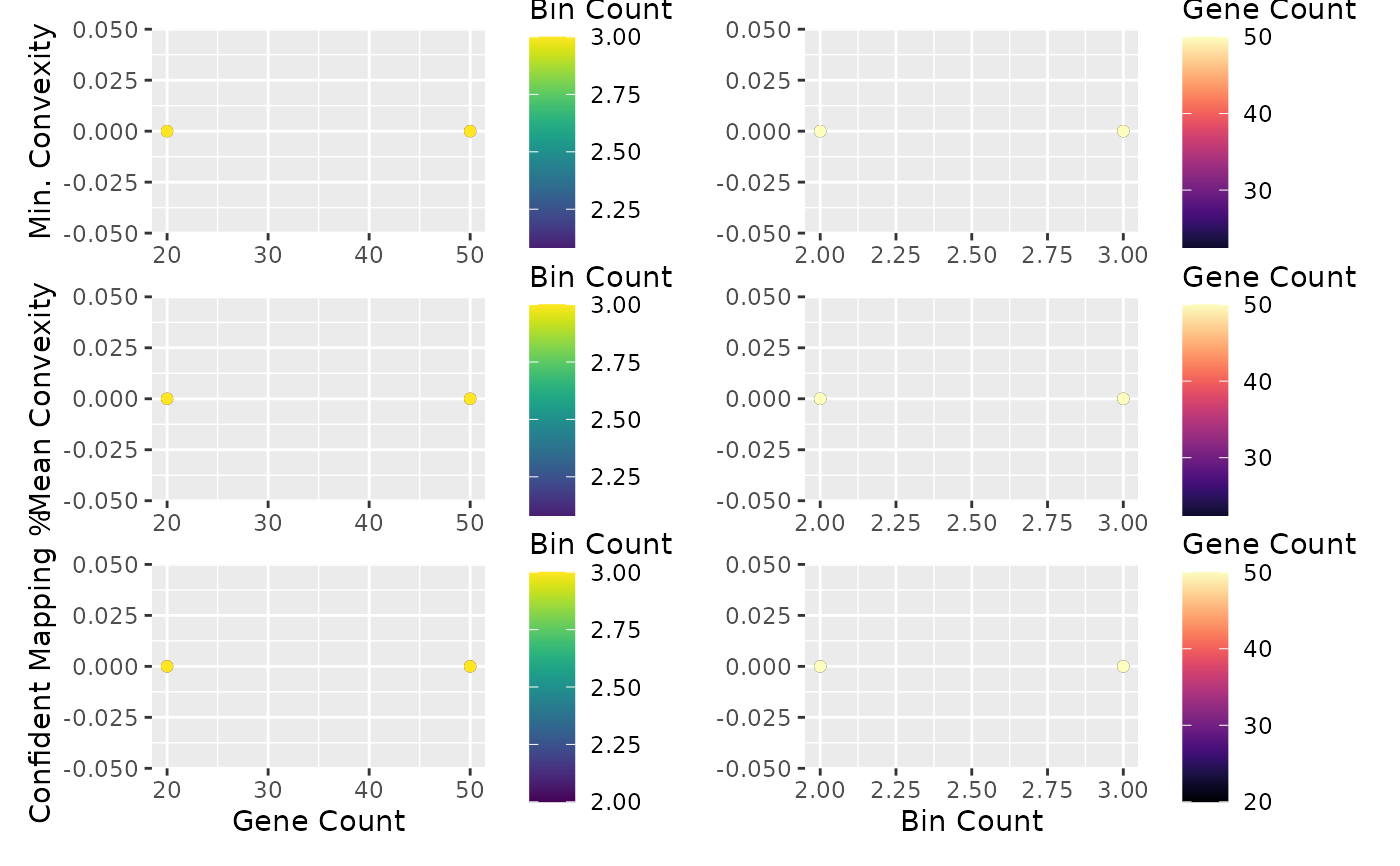
Value
A plot showing how convexity changes as n_bins and n_genes
are changed. See find_best_params() for details on how to interpret.
Examples
ncells <- 70
ngenes <- 100
counts_matrix <- matrix(
    c(seq_len(3500) / 10, seq_len(3500) / 5),
    ncol = ncells,
    nrow = ngenes
)
sce <- SingleCellExperiment::SingleCellExperiment(assays = list(
    normcounts = counts_matrix, logcounts = log(counts_matrix)
))
colnames(sce) <- paste0("cell", seq_len(ncells))
rownames(sce) <- paste0("gene", seq_len(ngenes))
sce$cell_type <- c(
    rep("celltype_1", ncells / 2),
    rep("celltype_2", ncells / 2)
)

sce$pseudotime <- seq_len(ncells) - 1
genelist <- rownames(sce)

# Finding the best params for the BlaseData
best_params <- find_best_params(
    sce, genelist,
    bins_count_range = c(2, 3),
    gene_count_range = c(20, 50),
    pseudotime_slot = "pseudotime",
    split_by = "pseudotime_range"
)
best_params
#>   column_label bin_count gene_count min_convexity mean_convexity
#> 1            1         2         20             0              0
#> 2            2         2         50             0              0
#> 3            1         3         20             0              0
#> 4            2         3         50             0              0
#>   strong_mapping_pct
#> 1                  0
#> 2                  0
#> 3                  0
#> 4                  0
plot_find_best_params_results(best_params)