Identify the Best Parameters For Your Dataset
find_best_params.RdIdentify the Best Parameters For Your Dataset
Usage
find_best_params(
  x,
  genelist,
  bins_count_range = c(5, 10, 20, 40),
  gene_count_range = c(10, 20, 40, 80),
  bootstrap_iterations = 200,
  BPPARAM = BiocParallel::SerialParam(),
  ...
)
Arguments
- x
The object to create `BlaseData“ from
- genelist
Vector of strings. The list of genes to use (ordered by descending goodness)
- bins_count_range
Integer vector. The n_bins list to try out
- gene_count_range
Integer vector. The n_genes list to try out
- bootstrap_iterations
Integer. Iterations for bootstrapping when calculating strong mappings.
- BPPARAM
The BiocParallel::BiocParallelParam. Defaults to BiocParallel::SerialParam
- ...
params to be passed to child functions, see
as.BlaseData()
Value
A dataframe of the results.
bin_count: Integer. The bin count for this attempt
gene_count: Integer. The top n genes to use for this attempt
min_convexity: Decimal. The worst convexity for these parameters
mean_convexity: Decimal. The mean convexity for these parameters
strong_mapping_pct: Decimal. The percent of bins which were strongly mapped to themselves for these parameters. If this value is low, then it is likely that in real use, few or no results will be strongly mapped.
See also
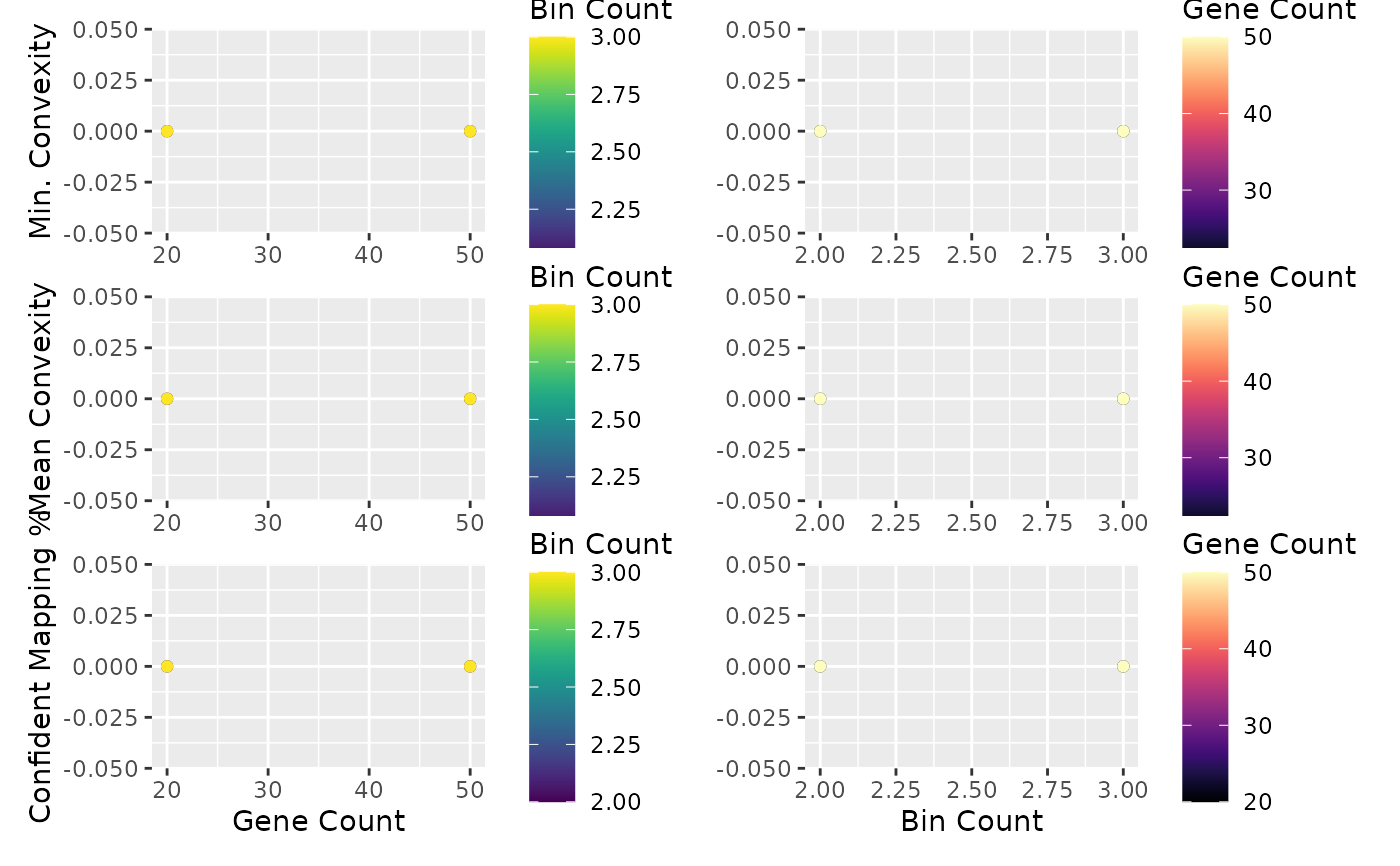
plot_find_best_params_results() for plotting the
results of this function.
Examples
ncells <- 70
ngenes <- 100
counts_matrix <- matrix(
    c(seq_len(3500) / 10, seq_len(3500) / 5),
    ncol = ncells,
    nrow = ngenes
)
sce <- SingleCellExperiment::SingleCellExperiment(assays = list(
    normcounts = counts_matrix, logcounts = log(counts_matrix)
))
colnames(sce) <- paste0("cell", seq_len(ncells))
rownames(sce) <- paste0("gene", seq_len(ngenes))
sce$cell_type <- c(
    rep("celltype_1", ncells / 2),
    rep("celltype_2", ncells / 2)
)

sce$pseudotime <- seq_len(ncells) - 1
genelist <- rownames(sce)

# Finding the best params for the BlaseData
best_params <- find_best_params(
    sce, genelist,
    bins_count_range = c(2, 3),
    gene_count_range = c(20, 50),
    pseudotime_slot = "pseudotime",
    split_by = "pseudotime_range"
)
best_params
#>   column_label bin_count gene_count min_convexity mean_convexity
#> 1            1         2         20             0              0
#> 2            2         2         50             0              0
#> 3            1         3         20             0              0
#> 4            2         3         50             0              0
#>   strong_mapping_pct
#> 1                  0
#> 2                  0
#> 3                  0
#> 4                  0
plot_find_best_params_results(best_params)