Evaluate Top Genes
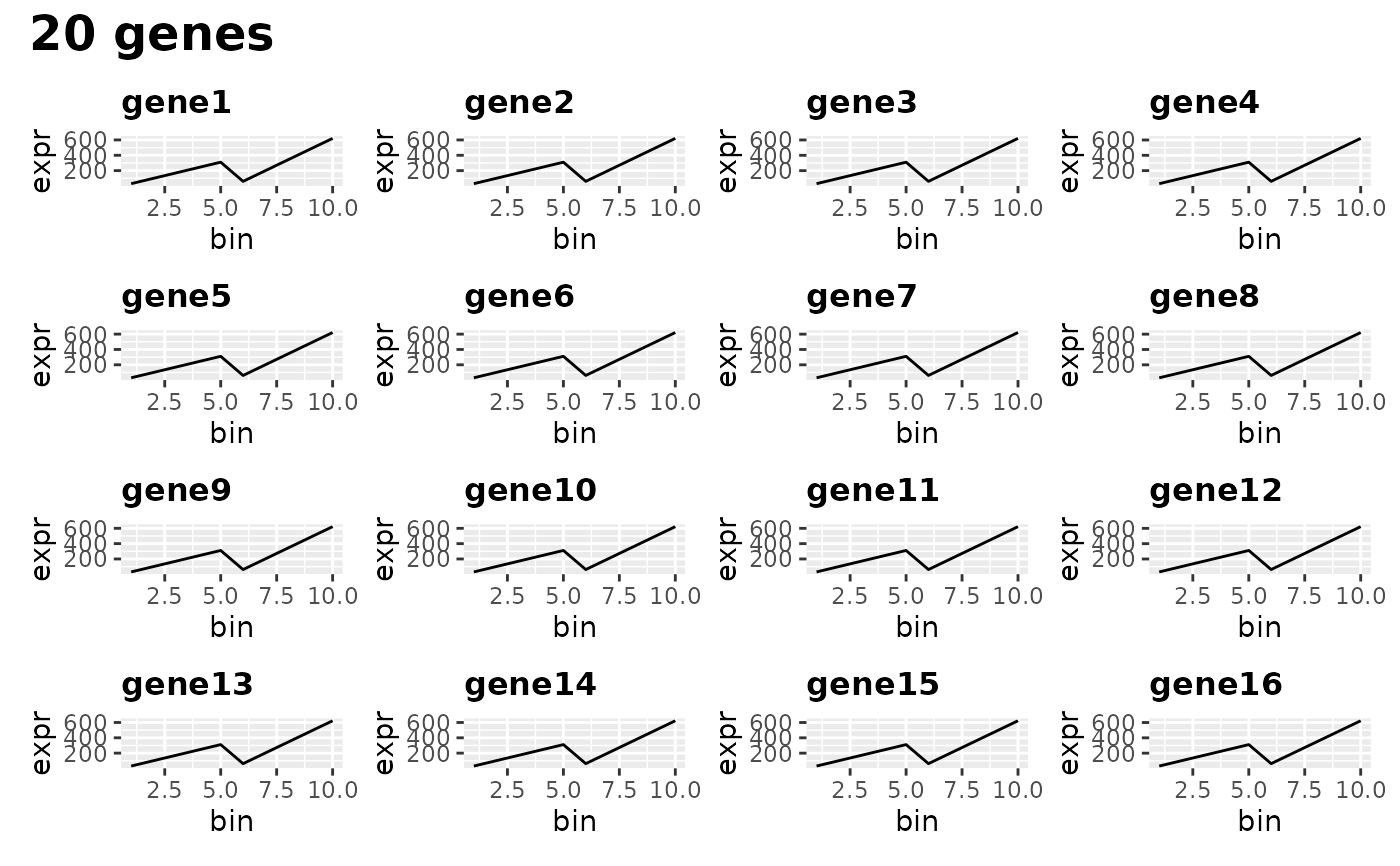
evaluate_top_n_genes.RdShows plots over bins of expression of the top n genes. This is designed to help identify if you have selected genes that vary over the pseudotime you have chosen bins to exist over. Uses the normcounts of the SCE.
Arguments
- blase_data
The BlaseData to get bins and expression from.
- n_genes_to_plot
Integer. The number of genes to plot.
- plot_columns
Integer. The number of columns to plot the grid with. Best as a divisor of
n_genes_to_plot.
Value
A ggplot2::ggplot2 plot showing the normalised expression of the top genes over pseudotime bins.
Examples
ncells <- 70
ngenes <- 100
counts_matrix <- matrix(
    c(seq_len(3500) / 10, seq_len(3500) / 5),
    ncol = ncells,
    nrow = ngenes
)
sce <- SingleCellExperiment::SingleCellExperiment(assays = list(
    normcounts = counts_matrix, logcounts = log(counts_matrix)
))
colnames(sce) <- paste0("cell", seq_len(ncells))
rownames(sce) <- paste0("gene", seq_len(ngenes))
sce$cell_type <- c(
    rep("celltype_1", ncells / 2),
    rep("celltype_2", ncells / 2)
)

sce$pseudotime <- seq_len(ncells) - 1
genelist <- rownames(sce)

# Evaluating created BlaseData
blase_data <- as.BlaseData(sce, pseudotime_slot = "pseudotime", n_bins = 10)
genes(blase_data) <- genelist[1:20]

# Check gene expression over pseudotime
evaluate_top_n_genes(blase_data)